Tristan Hume

Github Resume + Project List Blog

Hacking Math Homework

Many high school students complain about boring and repetitive homework, but I’ve found a fun way of dealing with this that I find actually helps me understand concepts even better. When faced with large rote assignments I write programs to complete the homework like no human can: instantly, perfectly and on a large scale. In the past I have written written Literary Analysis Visualizations, Punnet Square generators and Graphing Programs.

Most of the time it takes way more time to write the program than it would take to do the homework but I end up learning a lot more and having more fun. Recently I wrote my wrote my most outrageous program yet, it took 10 times longer than it should have and blew away my teacher and class.

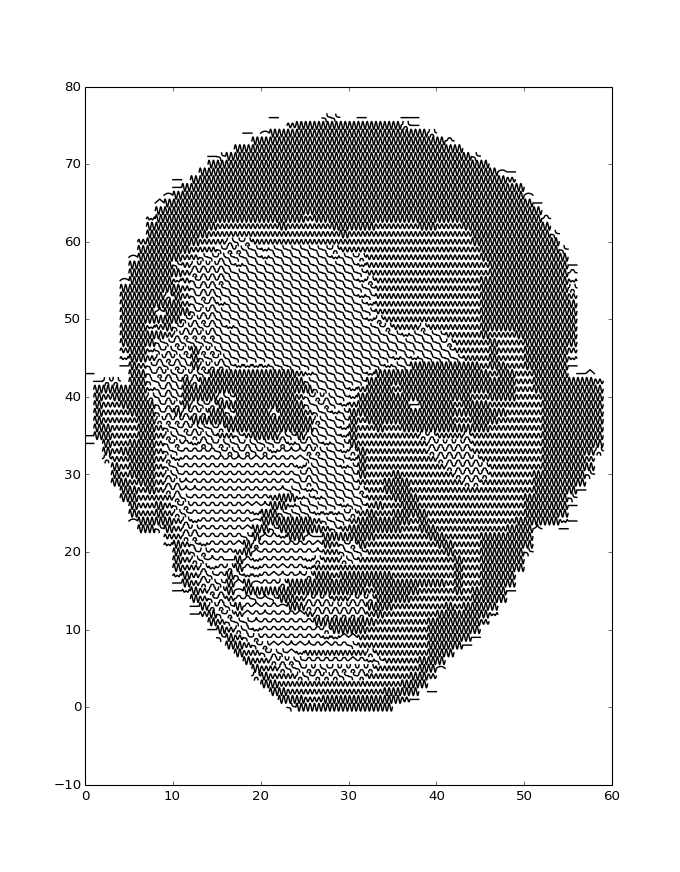
Part of my Advanced Functions class summative this year was to create a series of piecewise functions that when graphed produce a picture. Some examples given were line drawings of a smiley face and the Batman symbol. But I had an idea that would go beyond the intended simple line drawings so I spent my weekend implementing it.

I wrote a program that takes an image and composes equations of varying densities into hundreds of massive piecewise functions so that when you graph them on a very large canvas and zoom out they replicate the image in greyscale. The output looks like this:

Obama Function Collage

Additional Resources

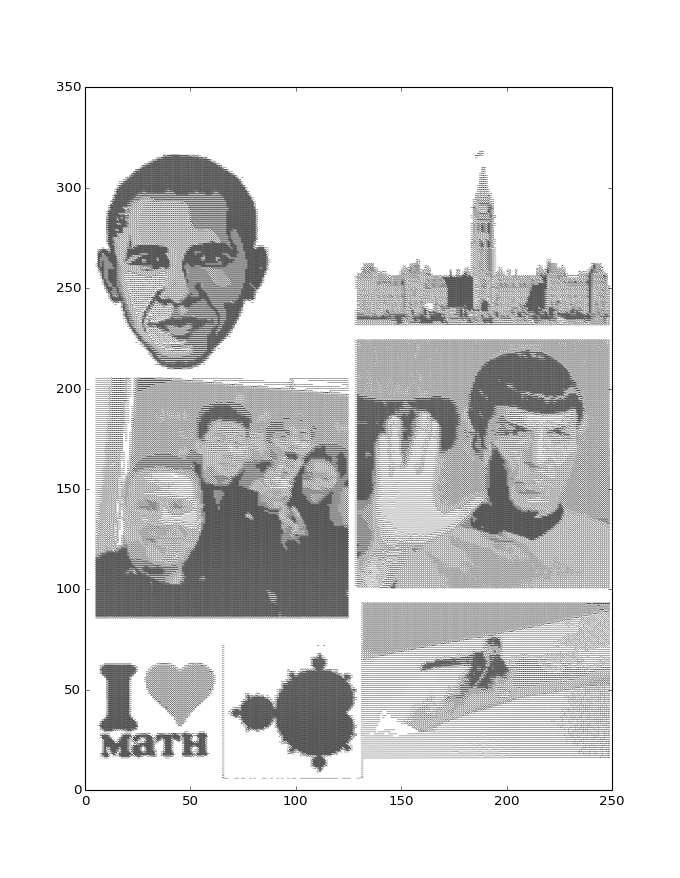
Another part of the program outputs a massive Latex document with all the large piecewise functions that produces a huge PDF. You can download a PDF that explains all the parts and has some more examples.

The Program

The program is written in Python and uses matplotlib, Numpy and Pillow. Excuse the terrible code with the manual constants, global variables and terrible logic structure. Not only was I learning Python while writing this but I had to finish the program by the next day and then never use the program again.

#!/usr/bin/env python
# -*- coding: utf-8 -*-
import numpy as np
import math
import string
import sys
import matplotlib.pyplot as plt
from PIL import Image
import random
from bisect import bisect_left, bisect, insort
# Setup
DOC_HEADER = """
\\documentclass[fleqn,legalpaper]{article}
\\usepackage[margin=0.5in]{geometry}
\\usepackage{amsmath}
\\usepackage{mathtools}
\\usepackage[active,tightpage]{preview}
\\renewcommand{\\PreviewBorder}{1in}
\\newcommand{\\Newpage}{\\end{preview}\\begin{preview}}
\\begin{document}
\\begin{preview}
\\title{Function Art Summative}
\\author{Tristan Hume}
\\maketitle
\\begin{abstract}
Here are all the functions that make up my artwork. They are generated by a program that takes an image file and translates the pixels into functions of varying densities. Each function represents a line of pixels in the image.
\\end{abstract}
\\section{Functions}
\\end{preview}
"""
DOC_FOOTER = """
\\end{document}
"""
FUNCTION_HEADER = """
\\begin{{preview}}
\\[
f_{{ {0} }}(x) =
\\begin{{dcases}}"""
FUNCTION_FOOTER = """
\\end{dcases}
\\]
\\end{preview}
"""
img_width = 250
img_height = 100
def fun_undef(x):
return None
def exp_undef(x, y, add):
pass
def fun_hline(x):
return 0.0
def exp_hline(x, y, add):
s = "{0:g}".format(y)
add(s, x, [(0.0, 1.0)])
def fun_quad(x):
return -x*(x-1.0)
def exp_quad(x, y, add):
s = "-x (x-{1:g}) + {0:g}".format(y,x+1.0)
add(s, x, [(0.0, 1.0)])
def fun_poly(x):
return 2000*(x**2)*(x-0.2)*((x-0.5)**2)*(x-0.8)*((x-1.0)**2)
def exp_poly(x, y, add):
s = "2000 x^2 (x-{1:g}) (x-{2:g})^2 (x-{3:g}) (x-{4:g})^2 + {0:g}".format(y,x+0.2,x+0.5,x+0.8,x+1.0)
add(s, x, [(0.0, 1.0)])
def fun_recip(x):
return 0.2/(10*(x-0.5))
def exp_recip(x, y, add):
s = "\\frac{{0.2}}{{10x-{1:g} }} + {0:g}".format(y, 5+10*x)
add(s, x, [(0.0, 0.45),(0.54,1.0)])
def fun_recip2(x):
return 0.01/((x-0.25)*(x-0.75))
def exp_recip2(x, y, add):
s = "\\frac{{0.01}}{{(x-{1:g}) (x-{2:g})}} + {0:g}".format(y, x+0.25, x+0.75)
add(s, x, [(0.0, 0.21),(0.3, 0.7),(0.79,1.0)])
def fun_abs(x):
return -abs(x - 0.5) + 0.5
def exp_abs(x, y, add):
s = "-|x-{1:g}| + {0:g}".format(y+0.5,x+0.5)
add(s, x, [(0.0, 1.0)])
def fun_log(x):
if x < 0.5:
return -0.4*math.log10(-(2.0*x-1.0))
else:
return -0.4*math.log10(2.0*x - 1.0)
def exp_log(x, y, add):
s = "-0.4 log(-2x+{1:g})) + {0:g}".format(y, 1+2*x)
add(s, x, [(0.0, 0.47)])
s = "-0.4 log(2x-{1:g})) + {0:g}".format(y, 2*x-1)
add(s, x, [(0.47, 1.0)])
def fun_logist(x):
if x < 0.5:
return 0.4/(1+math.e**(-25.0*x+7))
else:
return 0.4/(1+math.e**(25.0*x-18))
def exp_logist(x, y, add):
s = "\\frac{{0.4}}{{1+e^{{(-25x+{1:g})}} }} + {0:g}".format(y, 7+25*x)
add(s, x, [(0.0, 0.5)])
s = "\\frac{{0.4}}{{1+e^{{(25x-{1:g})}} }} + {0:g}".format(y, 18+25*x)
add(s, x, [(0.5, 1.0)])
def gen_sin(den,scale=0.5):
def fun_sin(x):
return scale*math.sin(den * math.pi * x)
return fun_sin
def gen_sin_exp(den,scale=0.5):
def exp_sin(x, y, add):
s = "{3:g} sin({2:g}\\pi x) + {0:g}".format(y+0.5,x, den,scale)
add(s, x, [(0.0, 1.0)])
return exp_sin
CATALOG = [
("line", fun_hline, exp_hline),
("log", fun_log, exp_log ),
("abs", fun_abs, exp_abs),
("quad", fun_quad, exp_quad),
("logist", fun_logist, exp_logist),
("reciprocal", fun_recip, exp_recip),
("reciprocal2", fun_recip2, exp_recip2),
("smallsin4", gen_sin(4,0.3), gen_sin_exp(4, 0.3)),
("largesin4", gen_sin(4,0.5), gen_sin_exp(4, 0.5)),
("polynomial", fun_poly, exp_poly)
]
# ZONES=[5, 30, 60, 100, 140, 180, 220]
ZONES=[10, 30, 40, 50, 60, 100, 140, 180, 220]
FUNS = [fun_undef, fun_hline, fun_quad, [fun_abs, fun_log], fun_logist, fun_poly, fun_recip, fun_recip2, gen_sin(4,0.3), gen_sin(4,0.5)]
# FUNS = [fun_undef, fun_hline, [fun_log, fun_abs, fun_quad, fun_logist], fun_poly, fun_recip, fun_recip2, gen_sin(4,0.3), gen_sin(4,0.5)]
INFO = [exp_undef, exp_hline, exp_quad, [exp_abs, exp_log], exp_logist, exp_poly, exp_recip, exp_recip2, gen_sin_exp(4,0.3), gen_sin_exp(4)]
# Drawing
def load_image(file_name):
global img_height, img_width
im = Image.open(file_name)
img_height = int((img_width/float(im.size[0])) * im.size[1])
im = im.resize((img_width, img_height),Image.BILINEAR)
print im.size
im = im.convert("L")
# im = im.convert("P", palette=Image.ADAPTIVE, colors=len(FUNS))
# im = im.convert("L")
im.save("out.png")
# pix = np.array(im)
# zones = np.unique(pix)
return im
def density(lum):
return bisect(ZONES,255 - lum)
def density_to_elem(den, elems):
e = elems[den]
if isinstance(e, list):
e = random.choice(e)
return e
def image_to_grid(im, elems):
grid = []
random.seed(55)
for row in xrange(im.size[1]):
row_list = []
for col in xrange(im.size[0]):
den = density(im.getpixel((col,row)))
# print den
elem = density_to_elem(den, elems)
row_list.append(elem)
grid.append(row_list)
return grid
def row_fun(grid, row, y):
def fun(n):
col = int(n)
x = n % 1.0
f = grid[row][col]
val = f(x)
if val == None or val < -0.5 or val > 0.5:
return None
return val + y
return fun
def plot_piece(fun):
global img_width
vfun = np.vectorize(fun)
x = np.linspace(0, img_width - 1, img_width * 150)
y = vfun(x)
row_plot = plt.plot(x, y, '-', linewidth=0.3)
plt.setp(row_plot, color='black')
# plt.show()
def plot_image(im, name="output"):
global img_width, img_height
grid = image_to_grid(im, FUNS)
fig = plt.figure()
for y in xrange(len(grid)):
f = row_fun(grid, len(grid) - y - 1, y)
plot_piece(f)
height = (img_height/float(img_width))*8.5
fig.set_size_inches(8.5, height)
# ax = plt.Axes(fig, [0.0, 0., img_width, img_height])
# ax.set_axis_off()
# fig.add_axes(ax)
filename = "output/{0}.png".format(name)
plt.savefig(filename, dpi=80)
# plt.show()
# Printing
function_count = 0
def restriction_string(res, offset):
return "{0:g} \\le x < {1:g}".format(res[0] + offset, res[1] + offset)
def restricts(restrictions, offset = 0.0):
strs = [restriction_string(r, offset) for r in restrictions]
return string.join(strs, ', ')
def write_function(f, y, row):
def add_piece(formula, offset, restrictions):
global function_count
function_count += 1
f.write("\n{0}, & {1}\\\\".format(formula, restricts(restrictions, offset)))
f.write(FUNCTION_HEADER.format(y))
for x, exp in enumerate(row):
exp(x,y,add_piece)
f.write(FUNCTION_FOOTER)
def create_functions_doc(im):
grid = image_to_grid(im, INFO)
f = open('functions.tex', 'w')
f.write(DOC_HEADER)
for idx, row in enumerate(grid):
write_function(f, len(grid) - idx, row)
f.write(DOC_FOOTER)
def print_piece(formula, offset, restrictions):
print "\\[f(x) = {0}, {1}\\]".format(formula, restricts(restrictions, offset))
# Mini Graphs
def plot_minifun(fun,name):
vfun = np.vectorize(fun)
x = np.linspace(0.0, 1.0, 400)
y = vfun(x)
fig = plt.figure()
fig.set_size_inches(2, 2)
ax = plt.Axes(fig, [0.0, 0., 1., 1.])
ax.set_ylim([-0.5,0.5])
# ax.set_axis_off()
fig.add_axes(ax)
row_plot = plt.plot(x, y, '-', linewidth=5)
plt.setp(row_plot, color='black')
plt.savefig(name, dpi = 80, bbox_inches='tight')
def minifun_darkness(name):
im = Image.open(name)
im = im.convert("L")
size = im.size[0] * im.size[1]
pix = np.array(im)
return np.average(pix)
# Test code
if len(sys.argv) < 2:
print "usage: art_gen.py imagename [doc]"
elif sys.argv[1] == "minifuns":
ordered = []
for (key, val, ev) in CATALOG:
filename = "minifuns/{0}.png".format(key)
plot_minifun(val, filename)
darkness = minifun_darkness(filename)
insort(ordered, (darkness, key))
print ordered
elif sys.argv[1] == "minidoc":
for (name, fun, efun) in CATALOG:
efun(0.0,0.0,print_piece)
else:
print sys.argv[1]
im = load_image(sys.argv[1])
if len(sys.argv) > 2:
com = sys.argv[2]
if com == "doc":
create_functions_doc(im)
print function_count
else:
plot_image(im)
view raw art_gen.py hosted with ❤ by GitHub