
Making reverse engineering tools for DEF CON Quals
Last weekend I played with Samurai in the DEF CON CTF Quals where I worked on a crazy problem which involved exploiting a program binary for a made-up architecture, which was running on a VM written for a weird made-up parallel machine architecture, running on another VM for that parallel machine which we only had outdated incorrect source code for.
Because of this crazy nested weird VM setup, most of me and my teammates’ time was spent building some really cool tooling for these two architectures so that we could figure out the program, understand, the vulnerability and test our exploit.
Full write-up from my teammate
My teammate Zack did an excellent write-up of the problem and our tools, go read it. He shows off the Binary Ninja disassembly plugin he wrote to make it easy to reverse-engineer the inner binary in an excellent UI. He also gives an overview of the work me and my other teammates did. It was really fun working with Zack, Sam, Emma, Brock and occasional others in Discord late into the night at various levels of exhaustion, often sharing screens and pair programming.
Reversing the Manchester VM binary
I first worked to help reverse-engineer the changes to the Manchester parallel machine interpreter that they had made since the previous year’s challenge using a similar machine that they had released code for. It made for some really fun reversing to have source code to reference but things had changed since and we needed to figure out what the changes did using only the binary.
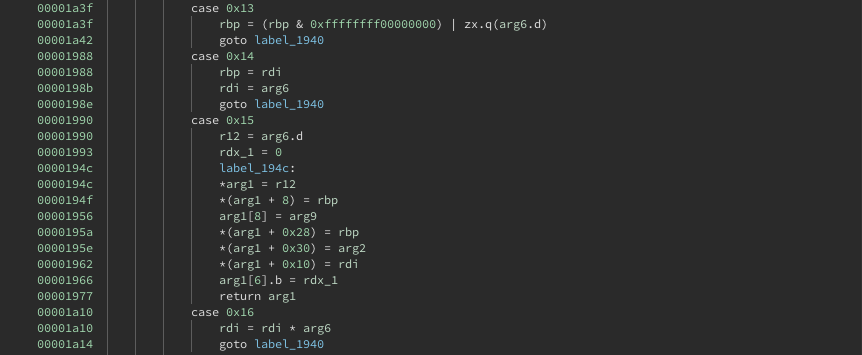
A cool feature that decompilers like Binary Ninja’s have is that you can give them type annotations and names that you figure out and it will use them to improve the decompilation. Whenever we figured something out, possibly annotated by a teammate using our comment syncing system, I’d update my type definitions to get a better decompilation. Here’s an example of some decompilation upon first opening the binary:
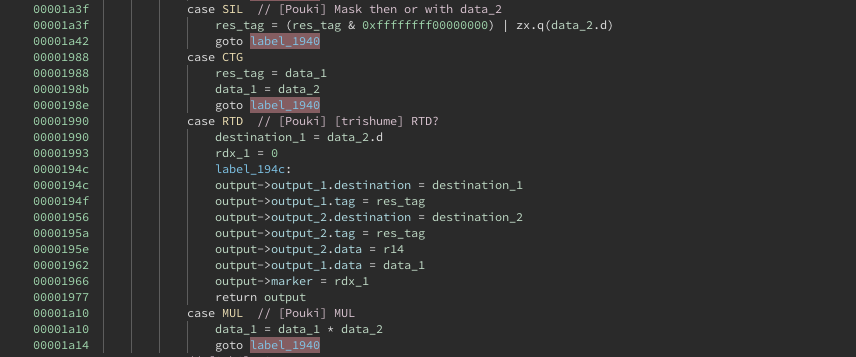
And after creating an enum type with all the VM instruction codes we figured out, and annotating the result structure type and parameter names:
Once we figured out the new opcode mappings and features of the VM my teammate Sam made the same changes to the old source code we had and verified that it could run the new Manchester programs we had. This helped check we got it right and also proved really useful for a later tool.
Fooling around with the Binary Ninja Debugger
I spent some time afterwards fooling around with getting the Binary Ninja debugger plugin to connect to the VM binary running in my Docker container and allow me to step through it over the GDB server protocol. This didn’t actually end up being that helpful, but I wanted to learn how to do it anyways because I find the idea of being able to debug a binary in a full reversing suite really cool. It took a lot of code reading since the way to do this using the plugin wasn’t documented.
Memory trace reconstruction tool
Armed with Zack’s Binary Ninja plugin for the inner VM, we were ready to work on exploiting the inner program, but we were having trouble understanding what was going on. It was hard to get information about what happened in the inner VM and running experiments took a long time since the nested weird VMs meant startup took minutes each time.
I set to work on a tool to gain more visibility into the system, and since I think about tracing tools a lot, I made a little tracing system. We had found some memory allocations that we figured stored state of the inner VM, so I modified Sam’s updated source to log every read and write to those memory regions so we could figure out what was going on.
It was surprisingly easy. I stored some info on each event in a uint64_t[4] array with the first field being an event ID and the following fields storing various useful info for each event. Then I cast it to a void* and wrote it to a file with fwrite, which is buffered so I didn’t have to worry about overhead from tons of write syscalls. It turns out there weren’t that many writes though so we later added a flush after each event so we could get streaming updates as the computation progressed.
Armed with this binary file in a very simple format, I opened in a hex editor, dragged the window until it was 4*8 bytes wide so it was kind of like an event log, and scrolled through it. I managed to identify which allocated region was the memory of the inner VM and which was the registers, and what offset all the registers were at.
So I wrote a little Python script which could read the trace and print out all the register values each time the program counter register changed, effectively giving us a window into the execution of the machine. Next I reconstructed all the VM memory contents from write events in the trace, which allowed dumping the memory contents at any instruction based on arbitrary conditions, or at the end of the execution.
This ended up synergizing really well with Zack’s plugin when developing our exploit. We could load the final memory state (which contained the program code as well) in Binary Ninja and it would disassemble everything, and we could even disassemble the shellcode we overflowed onto the stack and see how it had been corrupted by later writes. Then we could go back through the execution trace file and figure out where our exploit had gone wrong.
Zack even loaded the Binary Ninja API in the trace replay tool to add disassembly and symbol names of each executed instruction into the printed trace:
C1_epilogue_and_store+bc       02000200 PUSH    r2
   [pc=0x3c8 sp=0xf30 r1=0xaaa r2=0xef8 r4=0x67616c66 r8=0x2088000010101 flags=0x4]
log_name_read_len+2a9          01021800 MOV    r2, 0x18
   [pc=0xef8 sp=0xf30 r1=0xaaa r2=0xef8 r4=0x67616c66 r8=0x2088000010101 flags=0x4]
log_name_read_len+2ad          04022000 ADD    r2, pc
   [pc=0xefc sp=0xf30 r1=0xaaa r2=0x18 r4=0x67616c66 r8=0x2088000010101 flags=0x4]
log_name_read_len+2b1          01040400 MOV    r4, 0x4
   [pc=0xf00 sp=0xf30 r1=0xaaa r2=0xf18 r4=0x67616c66 r8=0x2088000010101 flags=0x4]
log_name_read_len+2b5          80010100 SVC    0x1, 0x1
   [pc=0xf04 sp=0xf30 r1=0xaaa r2=0xf18 r4=0x4 r8=0x2088000010101 flags=0x4]
Concluding Thoughts
Even though I didn’t work on as many different problems as I usually do for DC Quals (partially due to having my vaccine appointment and getting bowled over by immune reaction half way through), I had fun making a bunch of completely overkill tooling for a really hard problem.
Debugging using the execution trace was a really cool experience that made me yearn for more of that kind of omniscient debugging like Pernosco in my normal programming work. It was great being able to do things like “oh no when did that memory get the bad value” and just using text editor search functionality to find the last MOV to that address “backwards in time”. The “text file of every executed instruction” doesn’t scale to larger programs, but programs like rr and Pernosco do, and I want to use them more.
