
All my favorite tracing tools: eBPF, QEMU, Perfetto, new ones I built and more
Ever wanted more different ways to understand what’s going on in a program? Here I catalogue a huge variety of tracing methods you can use for varying types of problems. Tracing has been such a long-standing interest (and job) of mine that some of these will novel and interesting to anyone who reads this. I’ll guarantee it by including 2 novel tracing tools I’ve made and haven’t shared before (look for this: Tooling drop!).
What I see as the key parts of tracing are collecting timestamped data on what happened in a system, and then ideally visualizing it in a timeline UI instead of just as a text log. First I’ll cover my favorite ways of really easily getting trace data into a nice timeline UI, because it’s a superpower that makes all the other tracing tools more interesting. Then I’ll go over ways to get that data, everything from instrumentation to binary patching to processor hardware features.
I’ll also give a real-life example of combining eBPF tracing with Perfetto visualization to diagnose tail latency issues in huge traces by using a number of neat tricks. Look for the “eBPF Example” section.
Note: I’m hiring for my accelerator optimization team at Anthropic! See the bottom of the post for more detail.
Easily visualizing data on a trace timeline
Getting event data onto a nice zoomable timeline UI is way easier than most people think. Here’s my favorite method I do all the time which can take you from logging your data to visualizing it in minutes:
# from:
print("%d: %s %d" % (event_name, timestamp, duration))
# to:
with open('trace.json','w') as f:
  f.print("[")
  f.print('{"name": "%s", "ts": %d, "dur": %d, "cat": "hi", "ph": "X", "pid": 1, "tid": 1, "args": {}}\n' %
    (event_name, timestamp, duration))
  f.print("]") # this closing ] isn't actually required
This is the power of the Chromium Event JSON Format. It’s a super simple JSON format that supports a bunch of different kinds of events, and is supported by a lot of different profile visualizer tools.
You can view the resulting tracing files in Google’s Perfetto trace viewer by going to https://ui.perfetto.dev/, or in the older Catapult viewer (which is nicer for some traces) by going to chrome://tracing in Chrome. You can play around with the UI by going to Perfetto and clicking “Open Chrome Example” in the sidebar. Here’s a screenshot showing an event annotated with arguments and flow event arrows:
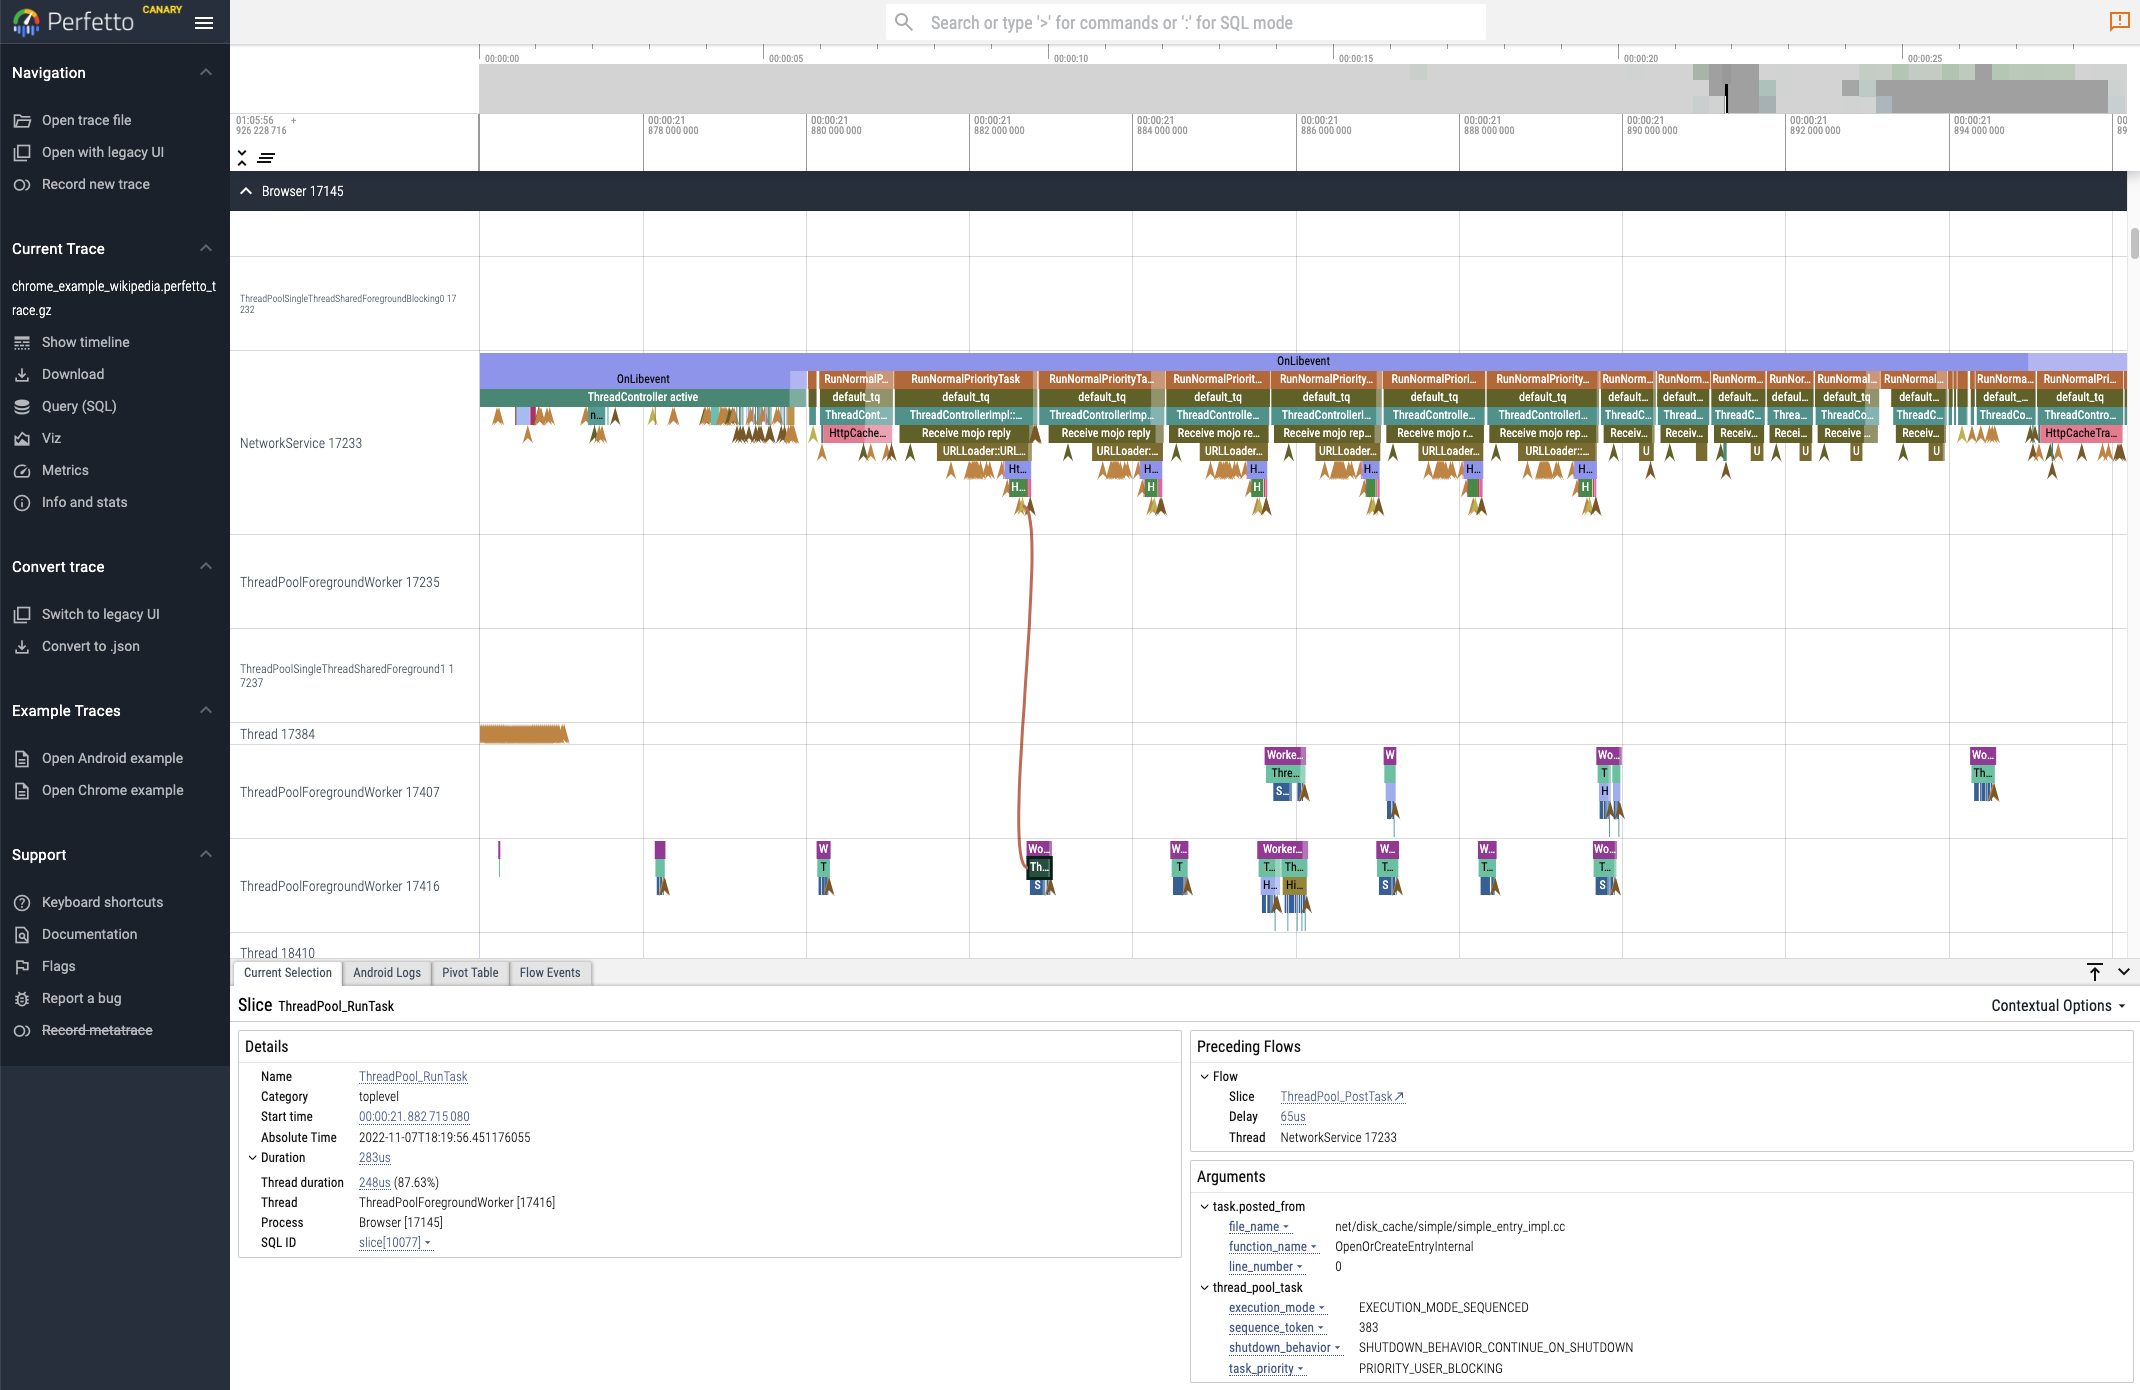
Me and my coworkers do this all the time at work, whip up trace visualizations for new data sources in under an hour and add them to our growing set of trace tools. We have a Python utility to turn a trace file into a clickable permanently-saved intranet link we can share with coworkers in Slack. This is easy to set up by building a copy of Perfetto and uploading to a file hosting server you control, and then putting trace files on that server and generating links using Perfetto’s ?url= parameter. We also write custom trace analysis scripts by loading the simple JSON into a Pandas dataframe.
I like Perfetto as its use of WebAssembly lets it scale to about 10x more events than Catapult (although it gets laggy), and you have the escape hatch of the native backend for even bigger traces. Its SQL query feature also lets you find events and annotate them in the UI using arbitrary predicates, including special SQL functions for dealing with trace stacks.
UI protip: Press ? in Perfetto to see the shortcuts. I use both WASD and CTRL+scroll to move around.
Advanced Format: Fuchsia Trace Format
The Chromium JSON format can produce gigantic files and be very slow for large traces, because it repeats both the field names and string values for every event. Perfetto also supports the Fuchsia Trace Format (FTF) which is a simple compact binary format with an incredible spec doc that makes it easy to produce binary traces. It supports interning strings to avoid repeating event names, and is designed around 64 byte words and supports clock bases so that you can directly write timestamp counters and have the UI compute the true time.
When I worked at Jane Street I used this to log instrumentation events to a buffer directly in FTF as they occurred in <10ns per span (it would have been closer to 4ns if it wasn’t for OCaml limitations).
Advanced Format: Perfetto Protobuf
Another format which is similarly compact, and also supports more features, is Perfetto’s native Protobuf trace format. It’s documented only in comments in the proto files and is a bit trickier to figure out, but might be a bit easier to generate if you have access to a protobuf library. It enables access to advanced Perfetto features like including callstack samples in a trace, which aren’t available with other formats. It’s slower to write than FTF, although Perfetto has a ProtoZero library to make it somewhat faster.
This can be really tricky to get right though and I had to reference the Perfetto source code to figure out error codes in the “info and stats” tab a lot. The biggest gotchas are you need to set trusted_packet_sequence_id on every packet, have a TrackDescriptor for every track, and set sequence_flags=SEQ_INCREMENTAl_STATE_CLEARED on the first packet.
Other tools
Some other nice trace visualization tools are Speedscope which is better for a hybrid between profile and trace visualization, pprof for pure profile call graph visualization, and Rerun for multimodal 3D visualization. Other profile viewers I like less but which have some nice parts include Trace Compass and the Firefox Profiler.
Tracing Methods
Now lets go over all sorts of different neat tracing methods! I’ll start with some obscure and interesting low level ones but I promise I’ll get to some more broadly usable ones after.
Hardware breakpoints
For ages, processors have supported hardware breakpoint registers which let you put in a small number of memory addresses and have the processor interrupt itself when any of them are accessed or executed.
perf and perftrace
Linux exposes this functionality through ptrace but also through the perf_event_open syscall and the perf record command. You can record a process like perf record -e \mem:0x1000/8:rwx my_command and view the results with perf script. It costs about 3us of overhead every time a breakpoint is hit.
Tooling drop! I wrote a tiny Python library called perftrace with a C stub which calls the perf_event_open syscall to record timestamps and register values when the breakpoints were hit.
It currently only supports execution breakpoints but you can also breakpoint on reads or writes of any memory and it would be easy to modify the code to do that. Hardware breakpoints are basically the only way to watch for accessing a specific memory address at a fine granularity which doesn’t add overhead to code which doesn’t touch that memory.
GDB scripting
In addition to using it manually, you can automate the process of following the execution of a program using debugger breakpoints by using GDB’s Python scripting interface. This is slower than perf breakpoints but gives you the ability to inspect and modify memory when you hit breakpoints. GEF is an extension to GDB that in addition to making it much nicer in general, also extends the Python API with a bunch of handy utilities.
Tooling drop! Here’s an example GDB script I wrote using GEF which gives examples of how to puppeteer, trace and inspect a program
Intel Processor Trace
Intel Processor Trace is a hardware technology on Intel chips since Skylake which allows recording a trace of every instruction the processor executes via recording enough info to reconstruct the control flow in a super-compact format, along with fine-grained timing info. It has extremely low overhead since it’s done by hardware and writes bypass the cache so the only overhead is reducing main memory bandwidth by about 1GB/s. I see no noticeable overhead at all on most program benchmarks I’ve tested.
You can access a dump of the assembly instructions executed in a recorded region using perf, lldb and gdb.
magic-trace
However assembly traces aren’t useful to most people, so when at Jane Street I created magic-trace along with my intern Chris Lambert, which generates a trace file (using FTF and Perfetto as described above) which visualizes every function call in a program execution. Jane Street generously open-sourced it so anyone can use it! Since then it’s been extended to support tracing into the kernel as well. I wrote a blog post about how it works for the Jane Street tech blog.

Processor Trace can record to a ring buffer, and magic-trace uses the hardware breakpoint feature described earlier to let you trigger capture of the last 10ms whenever some function that signals an event you want to look at happened, or when the program ends. This makes it great for a bunch of scenarios:
- Debugging rare tail latency events: Add a trigger function call after something takes unusually long, and then leave magic-trace attached in production. Because it captures everything you’ll never have not logged enough data to identify the slow part.
- Everyday performance analysis: A full trace timeline can be easier to interpret than a sampling profiler visualization, especially because it displays the difference between a million fast calls to a function and one slow call.
- It’s typical to find performance problems on systems that had only ever been analyzed with a sampling profiler by noticing the first time you magic-trace the program that many functions are being called more times than expected or in locations you didn’t expect.
- Debugging crashes: When a program crashes for reasons you don’t understand, you can just run it under magic-trace and see every function call leading up to the crash, which is often enough to figure out why the crash happened without adding extra logging or using a debugger!
If you want to modify magic-trace to suit your needs, it’s open-source OCaml. And if you like Rust more than OCaml someone made a simple Rust port called perf2perfetto.
Unfortunately, Processor Trace isn’t supported on many virtual machines that use compatible Intel Hardware. Complain to your cloud provider to add support in their hypervisor or try bare-metal instances!
Instrumentation-based tracing profilers
What most people use to get similar benefits to magic-trace traces, especially in the gamedev industry, is low-overhead instrumentation-based profilers with custom UIs. One major advantage of instrumentation-based traces is they can contain extra information about data and not just control flow, putting arguments from your functions into the trace can be key for figuring out what’s going on. These tools often support including other data sources such as OS scheduling info, CPU samples and GPU trace data. Here’s my favorite tools like this and their pros/cons:
Tracy

- Cross platform, including good Linux sampling and scheduling capture
- Overhead of only 2ns/span, supports giant traces with hundreds of millions of events
- Really nice and fast UI with tons of features (check out the demo videos in the readme)
- Integrates CPU sampling with detailed source and assembly analysis
- Popular so there are bindings in non-C++ languages like Rust and Zig.
- Con: Only supports a single string/number argument to events
- Con: Timeline is overly aggressive in collapsing small events into squiggles (see my post on this).
Optick

- Cross-platform, lots of features, very nice UI
- Supports multiple named arguments per event
- Con: Not as fleshed-out for non-game applications
- Con: sampling integration only works on Windows
Perfetto
- Perfetto UI is nice, events can include arguments and flow event arrows
- Integrates with other Perfetto data sources like OS events and sampling
- Con: Higher overhead of around 600ns/span when tracing enabled
- Con: UI doesn’t scale to traces as large as the above two programs
Other programs
There’s a bunch more similar small programs that generally come with their own instrumentation library and their own WebGL profile viewer. These are generally more lightweight and can be easier to integrate. For example Spall, microprofile, Remotery, Puffin (Rust-native), gpuviz. I must also mention the OCaml tracing instrumentation library I wrote for Jane Street which has overheads under 10ns/span via a compile-time macro like the C++ libraries.
eBPF
If you want to trace things using the Linux kernel there’s a new game in town, and it’s awesome. The eBPF subsystem allows you to attach complex programs to all sorts of different things in the kernel and efficiently shuttle data back to userspace, basically subsuming all the legacy facilities like ftrace and kprobes such that I won’t talk about them.
Things you can trace include: syscalls, low overhead tracepoints throughout the kernel, hardware performance counters, any kernel function call and arbitrary breakpoints or function calls/returns in userspace code. Combined these basically let you see anything on the system in or out of userspace.
You normally write BPF programs in C but there are perhaps even nicer toolkits for using Zig and Rust.
There’s a whole bunch of ways to use eBPF and I’ll talk about some of my favorites here. Some other favorites I won’t go into in detail are Wachy and retsnoop.
BCC: Easy Python API for eBPF
The BPF Compiler Collection (BCC) is a library with really nice Python bindings for compiling eBPF programs from C source code, injecting them, and getting the data back. It has a really nice feature where you can write a C struct to hold the event data you want to record, and then it will parse that and expose it so you can access the fields in Python. Check out how simple this syscall tracing example is.
I really like having the full power of Python to control my tracing scripts. BCC scripts often use Python string templating to do compile time metaprogramming of the C to compose the exact probe script you want, and then do data post-processing in Python to present things nicely.
bpftrace: terse DSL for eBPF tracing
If you want a terser way to compose tracing programs, in the style of dtrace, check out bpftrace. It lets you write one liners like these:
# Files opened by process
bpftrace -e 'tracepoint:syscalls:sys_enter_open { printf("%s %s\n", comm, str(args->filename)); }'

# Count LLC cache misses by process name and PID (uses PMCs):
bpftrace -e 'hardware:cache-misses:1000000 { @[comm, pid] = count(); }'
ply: simpler bpftrace
If you want something like bpftrace but simpler and faster with no LLVM dependencies. Check out ply.
# Which processes are receiving errors when reading from the VFS?
ply 'kretprobe:vfs_read if (retval < 0) { @[pid, comm, retval] = count(); }'
eBPF Example: Anthropic’s Perfetto-based packet and user event tracing
For work at Anthropic I wanted to analyze tail latency of some networking code so I used BCC and hooked into low-overhead kernel probe points to trace info from every single packet into a ring buffer. I could even include fields pulled from the packet header and NIC queue information, all at 1 million packets per second with no noticeable overhead.
Trick for tracing userspace events with low overhead in eBPF
I wanted to correlate packets with userspace events from a Python program, so I used a fun trick: Find a syscall which has an early-exit error path and bindings in most languages, and then trace calls to that which have specific arguments which produce an error. I traced the faccessat2 syscall such that in Python os.access(event_name, -932, dir_fd=-event_type) where event_type was an enum for start, stop and instant events would log spans to my Perfetto trace. This had an overhead of around 700ns/event, which is in a similar league to Perfetto’s full-userspace C++ instrumentation, and a lot of that is Python call overhead. The os.access function is especially good because when the syscall errors it doesn’t incur overhead by generating a Python exception like most other syscall wrappers do.
How to process events more quickly using a C helper with BCC
With 1 million packets per second I had a problem that with rare tail latency events, my traces quickly got huge and lagged Perfetto. I wanted to only keep data from shortly before one of my userspace send events took too long. Normally you’d do this with a circular buffer that gets snapshotted, and it would be possible to implement that in eBPF. But I didn’t want to implement my own ringbuf and the included ones don’t support wraparound overwriting. So instead I used the internal _open_ring_buffer function to register a ctypes C function as a ringbuffer callback instead of a Python function, and wrote an efficient C callback to filter out packets near a tail latency event before passing those to Python.
Perks of Perfetto visualization
I used the Perfetto Protobuf format with interned strings in order to keep trace size down to a few bytes per packet.
I could use Perfetto’s SQL support in the resulting trace to query for send events above a certain time threshold after startup in a specific process. Here’s a screenshot showing a long send event coinciding with packets starting to be paced out with larger gaps on one of the queues, including the ability to have line graph tracks:
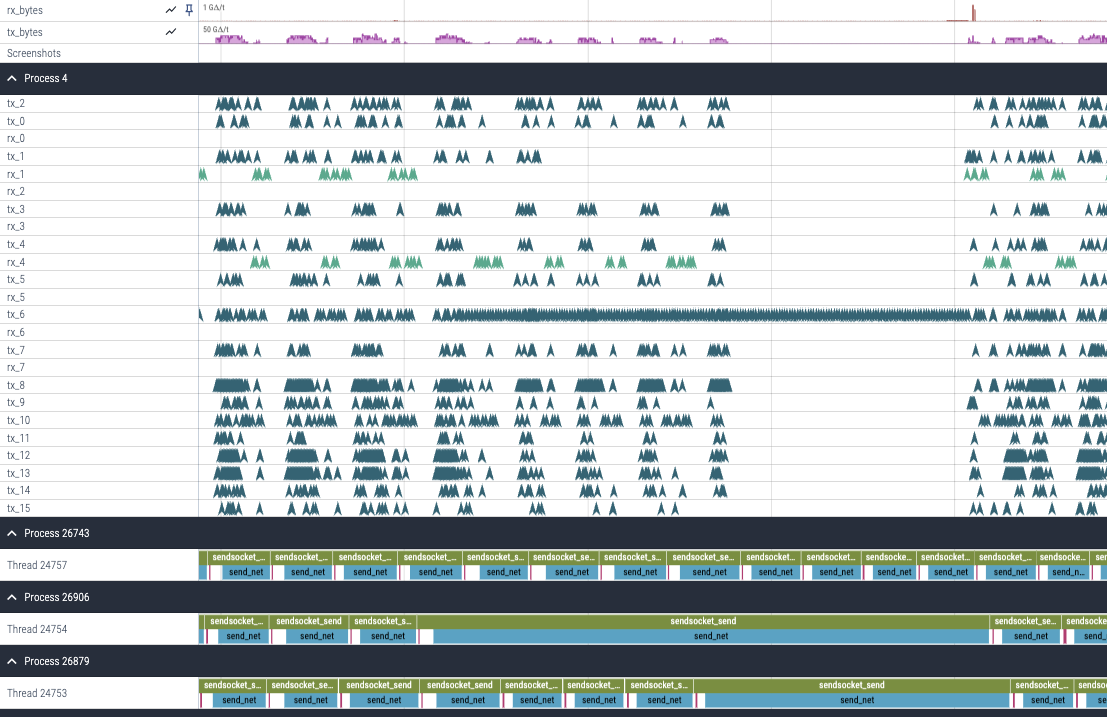
I think it’s kinda crazy that we have all these different mostly-text-based BPF tools rather than a framework that lets you put all sorts of different kinds of system events into a trace UI, including easily scripting your own new events. It’s so much easier to investigate this kind of thing with a timeline UI. I started building that framework at Anthropic, but only spent a week on it since I’ve had higher priority things to do since I did the packet latency investigation.
Binary Instrumentation
When you’re instrumenting userspace programs in a way where the overhead of kernel breakpoints is too high, but you don’t have access to the source code, perhaps because you’re reverse-engineering something, then it may be time for binary instrumentation.
bpftime: eBPF-based binary instrumentation
One easy way that’s a good segue is bpftime which takes your existing eBPF programs with userspace probes, and runs them much faster by patching the instructions to run the BPF program inside the process rather than incurring 3us of kernel interrupt overhead every time.
E9Patch
For more sophisticated binary patching on x86, look to E9Patch.
On some architectures, patching can be really easy since you just patch the instruction you want to trace with a jump to a piece of “trampoline” code which has your instrumentation, and then the original instruction and a jump back.
It’s much harder on x86 since instructions are variable length, so if you just patch a jump over a target instruction, occasionally that’ll cause problems since some other instruction jumps to an instruction your longer jump had to stomp over.
People have invented all kinds of clever tricks to get around these issues including “instruction punning” where you put your patch code at addresses which are also valid x86 nop or trap instructions. E9Patch implements very advanced versions of these tricks such that the patching should basically always work.
It comes with an API as well as a tool called E9Tool which lets you patch using a command line interface:
# print all jump instructions in the xterm binary
$ e9tool -M jmp -P print xterm
jz 0x4064d5
jz 0x452c36
...
Frida
The other way to get around the difficulty of static patching, when you have to be conservative around how jumps you don’t know about could be messed up by your patches, is dynamic binary instrumentation, where you basically puppeteer the execution of the program. This is the technique used by JIT VMs like Rosetta and QEMU to basically recompile your program as you run it.
Frida exposes this incredibly powerful technique in a general way you can script in Javascript using its “Stalker” interface. Allowing you to attach JS snippets to pieces of code or rewrite the assembly as it is run. It also lets you do more standard patching, although it doesn’t work as well on x86 as E9Patch.
LD_PRELOAD
If you just want to trace a function in a dynamic library like libc, you can use LD_PRELOAD to inject a library of your own to replace any functions you like. You can use dlsym(RTLD_NEXT, "fn_name") to get the old implementation in order to wrap it. Check out this tutorial post for how.
Distributed Tracing
Distributed Tracing is where you can trace across different services via attaching special headers to requests and sending all the timing data back to a trace server. Some popular solutions are OpenTelemetry (of which there are many implementations and UIs) and Zipkin.
There’s some cool new solutions like Odigos that use eBPF to add distributed tracing support without any instrumentation.
Sampling Profilers
Sampling profilers take a sample of the full call stack of your program periodically. Typical profiler UIs don’t have the time axis I’d think of as part of “tracing”, but some UIs do. For example Speedscope accepts many profiler data formats and can visualize with a time axis, and Samply is an easy to use profiler which uses the Firefox Profiler UI, which also has a timeline view.
One neat sampling method used by py-spy and rbspy is to use the process_vm_readv syscall to read memory out of a process without interrupting it. If like an interpreter the process stores info about what it’s doing in memory, this can allow you to follow it with no overhead on the target process. You could even use this trick for low-overhead native program instrumentation: set up a little stack data structure where you push and pop pointers to span names or other context info, and then sample it from another program when needed using eBPF or process_vm_readv.
QEMU Instrumentation
When all other tracing tools fail, sometimes you have to fall back on the most powerful tool in the tracing toolbox: Full emulation and hooking into QEMU’s JIT compiler. This theoretically allows you to trace and patch both control flow and memory, in both userspace and the kernel, including snapshot and restore, across many architectures and operating systems.
However, actually doing this is not for the faint of heart and the tooling for it only barely exists.
Cannoli
Cannoli is a tracing engine for qemu-user (so no kernel stuff) which patches QEMU to log execution and memory events to a high-performance ringbuffer read by a Rust extension you compile. This lets it trace with very low overhead by spreading the load of following the trace over many cores, at the cost of not being able to modify the execution.
It’s a bit tricky to use, you have to compile QEMU and Cannoli yourself at the moment, and it’s kind of a prototype so when I’ve used it in the past for CTFs I’ve often had to add new features to it.
QEMU TCG Plugins
QEMU has recently added plugin support for its TCG JIT. Like Cannoli this is read-only for now, and its likely slower than Cannoli, but it works in qemu-system mode and exposes slightly different functionality.
usercorn
My friend has an old project called usercorn that is mostly bitrotted but has the ability to trace programs using QEMU and analyze them with Lua scripts and all sorts of fancy trace analysis. Someone (possibly him eventually) could theoretically revive it and rebase it on top of something like QEMU TCG plugins.
Conclusion: If you liked this you may like my team at Anthropic
If you made it to the bottom and enjoyed all those different tracing strategies, you may also be interested in working on my team!
I lead the performance optimization team at Anthropic (we build one of the world’s leading large language models, and have a heavy focus on figuring out how future more powerful models can go well for the world). We’ll be doing accelerator kernel optimization across GPUs, TPUs and Trainium. TPUs and Trainium are cool in that they’re simpler architectures where optimization is more like a cycle-counting puzzle, and they also have amazing tracing tools. Almost nobody knows these new architectures, so we’re currently hiring high potential people with other kinds of low-level optimization experience who are willing to learn.
I plan for us to do a bunch of optimization work as compiler-style transformation passes over IRs, but simpler via being bespoke to the ML architecture we’re optimizing. These will parallelize architectures across machines, within a machine, and within a chip in similar ways. We also work closely with an amazing ML research team to do experiments together and come up with architectures that jointly optimize for ML and hardware performance.
Anthropic recently received ~$6B in funding commitments, and are investing it heavily in compute. We currently have ~5 performance specialists, with each one making an immense contribution in helping us have models that exhibit interesting capabilities for our alignment researcher and policy teams.
AI now is still missing a lot, but progress is incredibly fast. It’s hard for me to say the coming decade of progress won’t lead to AI as good as us at nearly all jobs, which would be the biggest event in history. Anthropic is unusually full of people who joined because they really care about ensuring this goes well. I think we have the world’s best alignment, interpretability research, and AI policy teams, and I personally work on performance optimization here because I think it’s the best way to leverage my comparative advantage to help the rest of our efforts succeed at steering towards AI going well for the world in the event it keeps up this pace.
If you too would like to do fun low-level optimization on what I think will be the most important technology of this decade and want to chat: Email me at [email protected] with a link or paragraph about the most impressive low-level or performance thing you’ve done. And feel free to check out some of my other performance writing.
